
Anne-Claire Brunet - Data scientist Kaduceo
Hospital Emergency Departments (ED) are finding it increasingly difficult to cope with the incoming flow of patients. The risk of overcrowding is a real threat to the standard of care. In this context, forecasting ED is a serious challenge. The deployment of a forecasting model for ED admissions could allow these departments and the hospitals to organise themselves better (materials, personnel, ...) in advance.
Most of the time, classical time series analysis models (such as ARIMAX) have been used to try to solve this problem. But with these models there is an assumption that the relationships between the variables is linear: this can be too restrictive, or even unrealistic. Indeed, we could for example expect that during heat waves there is an increase in ED admissions. However in this example, the relationship between the temperature variable and the number of admissions is not linear: it is not the increase in temperature that defines a heat wave episode, but the fact that the temperatures stagnate at high levels.
A new approach: deep learning
To overcome the linear assumptions, we can use deep learning techniques. These networks are capable of taking into account past observations while modelling their impact on the present according to complex and non-linear patterns. We could therefore try to maximise the accuracy of our forecasts by using such a model. To do so, the model could use the maximum amount of information that could help predict an increase of hospital activity.
With artificial intelligence (AI) models, it is possible to build this type of complex model, while taking into account a large number of variables of different types (weather, air quality, cultural events, traffic, etc..).
0 years of observationsA network is defined by its number of layers as well as a specific architecture. Both of these elements will determine the quality of the model. There is no pre-established model nor architecture which will always take the best advantage of the input information. Each use case can require the design of a different network. The type of layers used in the network depends on the type of input variable. For the forecasting of ED, the input data is temporal data. In a recurrent neural network, LSTM or GRU layers "with a memory" allow the relationships between past and future observations to be modelled. The challenge is to define an optimal network architecture.
A network is not completely intelligent... But it is capable of learning by following the rules of action that we give it.
Indeed, simply adding more input information may not be enough to increase the quality of the forecasts. The more complex the model, the more care must be taken to ensure that the data is correctly processed within the network.
A pratical example:
The following example's aim is to illustrate the importance of the network design stage. We built three models. Each of these models goal is to forecast at d+1 the number of ED based on the observation of the variables over the previous 15 days.
The first model (M1) uses the past observations of the daily number of admissions as input. In the two other models (M2 and M3), we added information on the characteristics of the days (day of the week, month, bank holiday, school holidays), as well as weather data (min and max temperature, humidity rate and precipitation measurement).
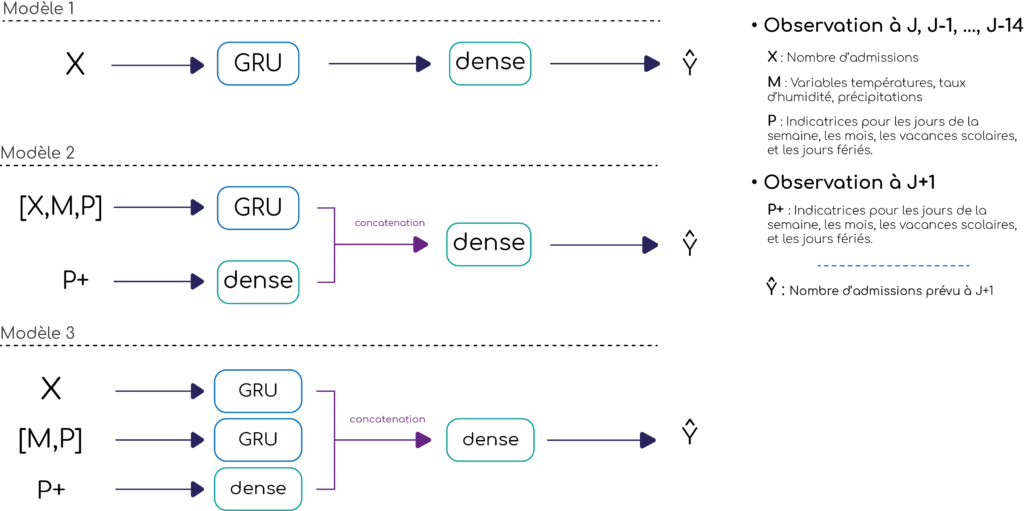
The input variables for the models M2 and M3 are the same, but their architecture is different. The models are described in Figure 1. In the M2 model, the first step for all of the inputs (the number of admissions, the day characteristics and weather variables) is to go through a single GRU layer in the network. In the M3 model we use two layers in parallel: one for the past admissions, and an other for the weather and characteristics data. In addition to the GRU layers, we add in parallel, a dense layer, with the day characteristics for which we are forecasting as input, i.e. d+1.
Figure 1 : Architecture of the different models
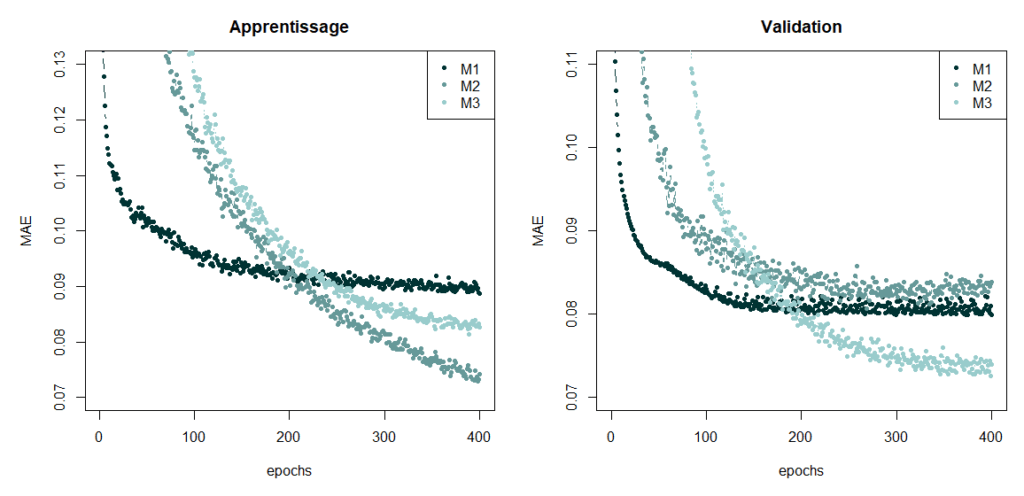
We trained the three networks using data from the Centre Hospitalier Intercommunal de Créteil (CHIC) over a period of 7 years, the goal being to minimise the mean absolute error (MAE). The evolution of the MAE on the training and validation sets, at each iteration or epoch, is represented in Figure 2. The M1 model has the largest error value on the training set whereas the M2 model has the smallest. However, we can see that the M2 model has difficulties generalising, since it is the least efficient on the validation set. It is the M3 model which has the smallest MAE value on the validation set. The performance of the model is thus improved by positioning GRU layers in parallel.
Figure 2 : Performance of the models
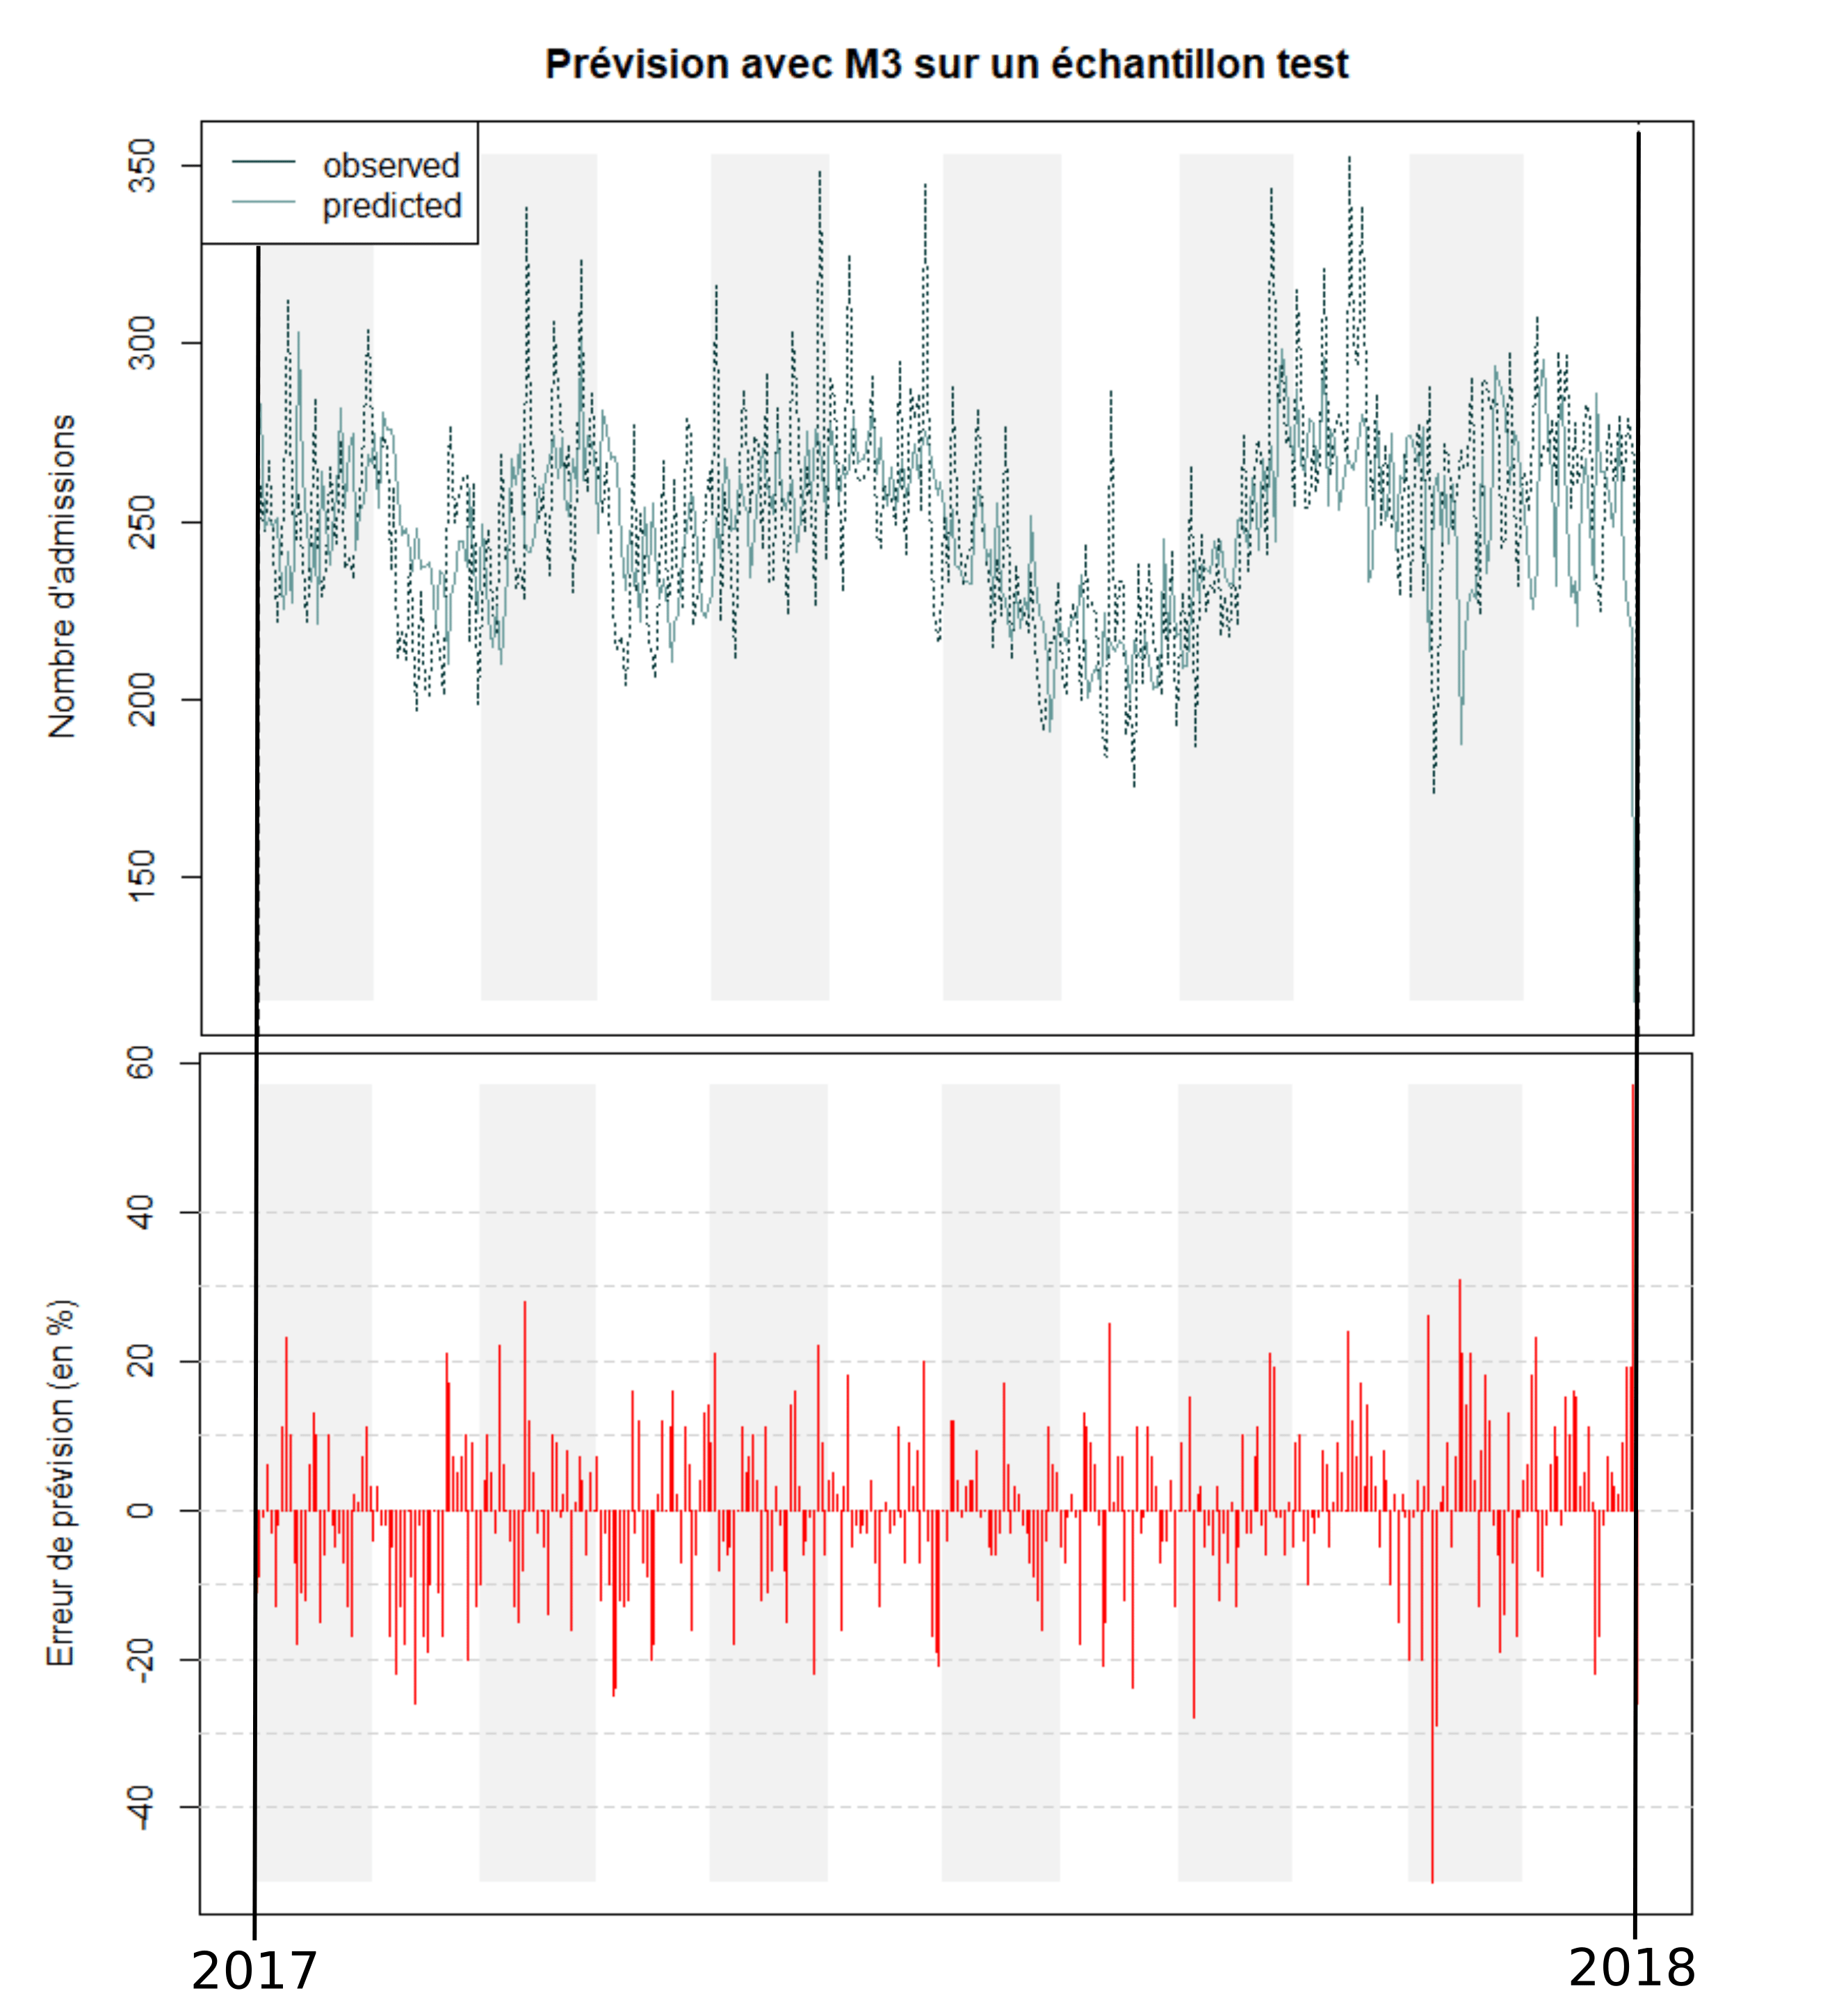
The forecasts with this model on a test sample (year 2017) and the error percentage for each forecast can be found in Figures 3 and 4. On average, during the year 2017, the daily number of admissions was 251. Our model has an average error of 22 admissions per day, i.e. 9% of the average daily number of admissions.
Figure 3 : Prediction on a test sample
The search of performance
The performance of the model also depends on the choice of several parameters: number of layers, number of neurons, regularisation parameters to avoid overfitting, the size of the datasets at each iteration, etc. In practice, it is not possible to optimise all of these parameters simultaneously. The identification of optimal parameters is a complicated step in the analysis. A good compromise must be found between the complexity of the model and its generalisation capability. In other words, if we create a model that is too complex, by multiplying the number of layers and neurons, the model will have a small error rate on the training set and a high error rate on any other dataset. It is this phenomenon of overfitting that needs to be limited.
In this example, we present a fairly simple model for predicting the number of ED admissions. We manage to have fairly reasonable results, but they are still not good enough. Therefore, we then considered different ways to try to improve the results, our goal being to provide a complete management tool for the ED. We are currently working on such a model, capable of forecasting at one-week the admissions in different hospital departments.
The main challenge is to provide forecasts that are reliable enough for warning hospitals when a peak in the activity is expected.
For each department, we tried to enrich the model with variables that may have an influence on the number of admissions. For example, in order to forecast bronchiolitis epidemics which have an impact on the paediatric emergency department, we use air quality data.
A predictive tool to support decision making
The advantage of AI models is that they are capable of identifying complex relationships between variables, while taking into account a large number of explanatory variables. Their main limitation is that they are rather difficult to interpret ("black box issue"), as it is difficult to understand a posteriori how the different variables interact. However, in our context, this limitation is not a problem since the model would be provided for organisational and not medical purposes.
We are not trying to find which variables impact the hospital activity, but to build a tool capable of warning hospitals when a peak in the activity is expected. By doing so, we would make it possible to plan the necessary resources beforehand.